How to capture a web browser console log for troubleshooting purposes
Originally Published: 2018-03-16
Article Number
Applies To
Platform: Google Chrome, Mozilla Firefox
Issue
The general method for capturing a browser console log in most web browsers:
- Navigate to the web browser tab where you will reproduce the issue.
- From the web browser's tools menu, open the developer tools menu item.
- Choose the console log option.
- Where available, choose the preserve or persist log option. This ensures that logging is saved across page reloads.
- Reproduce the issue.
- Save the log to send to RSA Customer Support.
Resolution
Google Chrome (v64)
- Open a new browser tab in Google Chrome.
- Click on the three dot menu in the upper right corner of the Chrome window (it has a tooltip labeled Customize and control Google Chrome):
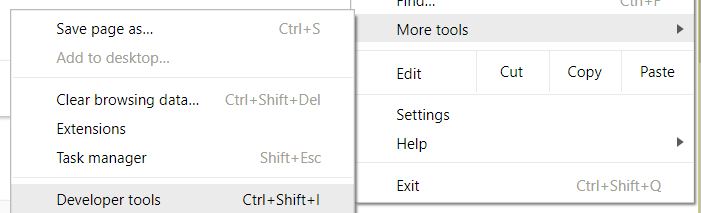
- Select More Tools > Developer Tools:
- A new frame will open up in your Chrome tab, showing some markup language, and a menu at the top that looks like this:
- Click on Console in the menu, to start the browser console for this tab.
- Click on the blue cog icon
on the right of the browser console. Some checkboxes will be displayed in the browser console as shown below:
If some apparent errors are displayed in the browser console window, such as in the example above, they can safely be ignored.
- Make sure that the options to both Preserve Log and Show Timestamps are checked. Any displayed messages will now show timestamps, as shown below.
- You are now ready to test. Reproduce the issue in the same Chrome tab where the browser console is running. While you are testing, output will be logged by Chrome to the browser console.
- When the test is complete, right-click any of the messages in browser console window, and choose Save as... from the displayed menu.
- When prompted, specify a location to save the browser console log file. Note the filename and location so you can send the file to RSA Support.
Mozilla Firefox (v58)
- Open a new browser tab in Firefox.
- Click to open the three bar menu in the upper right corner of the Firefox window (it has a tooltip labeled Open menu):
- Select Web Developer > Web Console from the Firefox menu. The browser console will be displayed:
- Click the cog icon on the right of the browser console (it has a tooltip labeled Toolbox options):
- Scroll down to the Web Console section in the center of the browser console and tick the checkbox option for Enable timestamps.
- Click the Console item on the browser console menu to return to the console view, then tick the Persist Logs checkbox on the far right of the menu.
The console menu should now look like this:
- You are now ready to test. Reproduce the issue in the same Firefox tab where the browser console is running. While you are testing, output will be logged by Firefox to the browser console.
- When the test is complete, right-click any of the messages in browser console window, and choose Select All from the displayed menu. This will highlight all the messages in the window.
- Keeping all the messages highlighted, right click them and select Copy Message to copy all the messages to the Clipboard:
- Paste the messages into a file using a text editor such as Notepad (Windows) or TextWrangler (macOS).
- Save the file and note the folder and filename to send to RSA Customer Support.
Notes
- A browser console log may be requested by RSA Engineering to help diagnose problems shown by a web browser.
- By default, the browser console is cleared each time you navigate to a new page or reload the current page. Normally Engineering will require the "persist" or "preserve" log option (depending on browser) to be checked to override that behavior (as advised in the instructions above) Consequently Chrome or Firefox are preferred because they have that option. Some versions of Microsoft Edge or Internet Explorer may not have this option.
- A browser console only captures data from the current tab. If a web page opens a new tab or window, the data in the new tab or window will not be captured.
- A browser console log will typically be requested by Engineering in conjunction with a browser network trace. A FiddlerCap capture is preferable to the browser's network trace option, as it will capture data from multiple tabs. The instructions for FiddlerCap are browser-agnostic. The end user can uninstall FiddlerCap at any time.